Ethereum vs. Bitcoin: ETH price poised for 80% rally in 2026

cointelegraphPublished on 2025-12-11Last updated on 2025-12-11

Abstract

Ethereum's Ether (ETH) could surge over 80% against Bitcoin (BTC) in 2026, according to a bullish inverse head-and-shoulders pattern forming on its long-term chart. The pattern suggests a potential rise toward 0.059–0.063 BTC. This mirrors a similar 2019-2020 accumulation phase that preceded a 450% rally. However, ETH remains constrained by a multi-year descending trendline that has capped gains since 2017. A rejection at this resistance could invalidate the bullish setup and trigger a decline back to 0.0175 BTC support. The analysis highlights both the optimistic scenario and key risks, emphasizing that the long-term downtrend against Bitcoin is not yet definitively broken.

Ethereum’s Ether (ETH) token may rally by over 80% versus Bitcoin (BTC) in 2026, according to a classic bullish reversal scenario developing on its long-term charts.

Key points:

  • ETH/BTC charts point to a potential move toward 0.059–0.063 BTC in 2026.

  • Rejection at the long-term trendline could send the pair back toward 0.0175 BTC.

Ether price chart hints at 80% rally versus Bitcoin

As of December, ETH/BTC’s 2-week chart displayed a textbook inverse head-and-shoulders (IH&S) formation, a classic bullish reversal pattern that typically follows prolonged downtrends.

ETH/BTC two-week chart. Source: TradingView

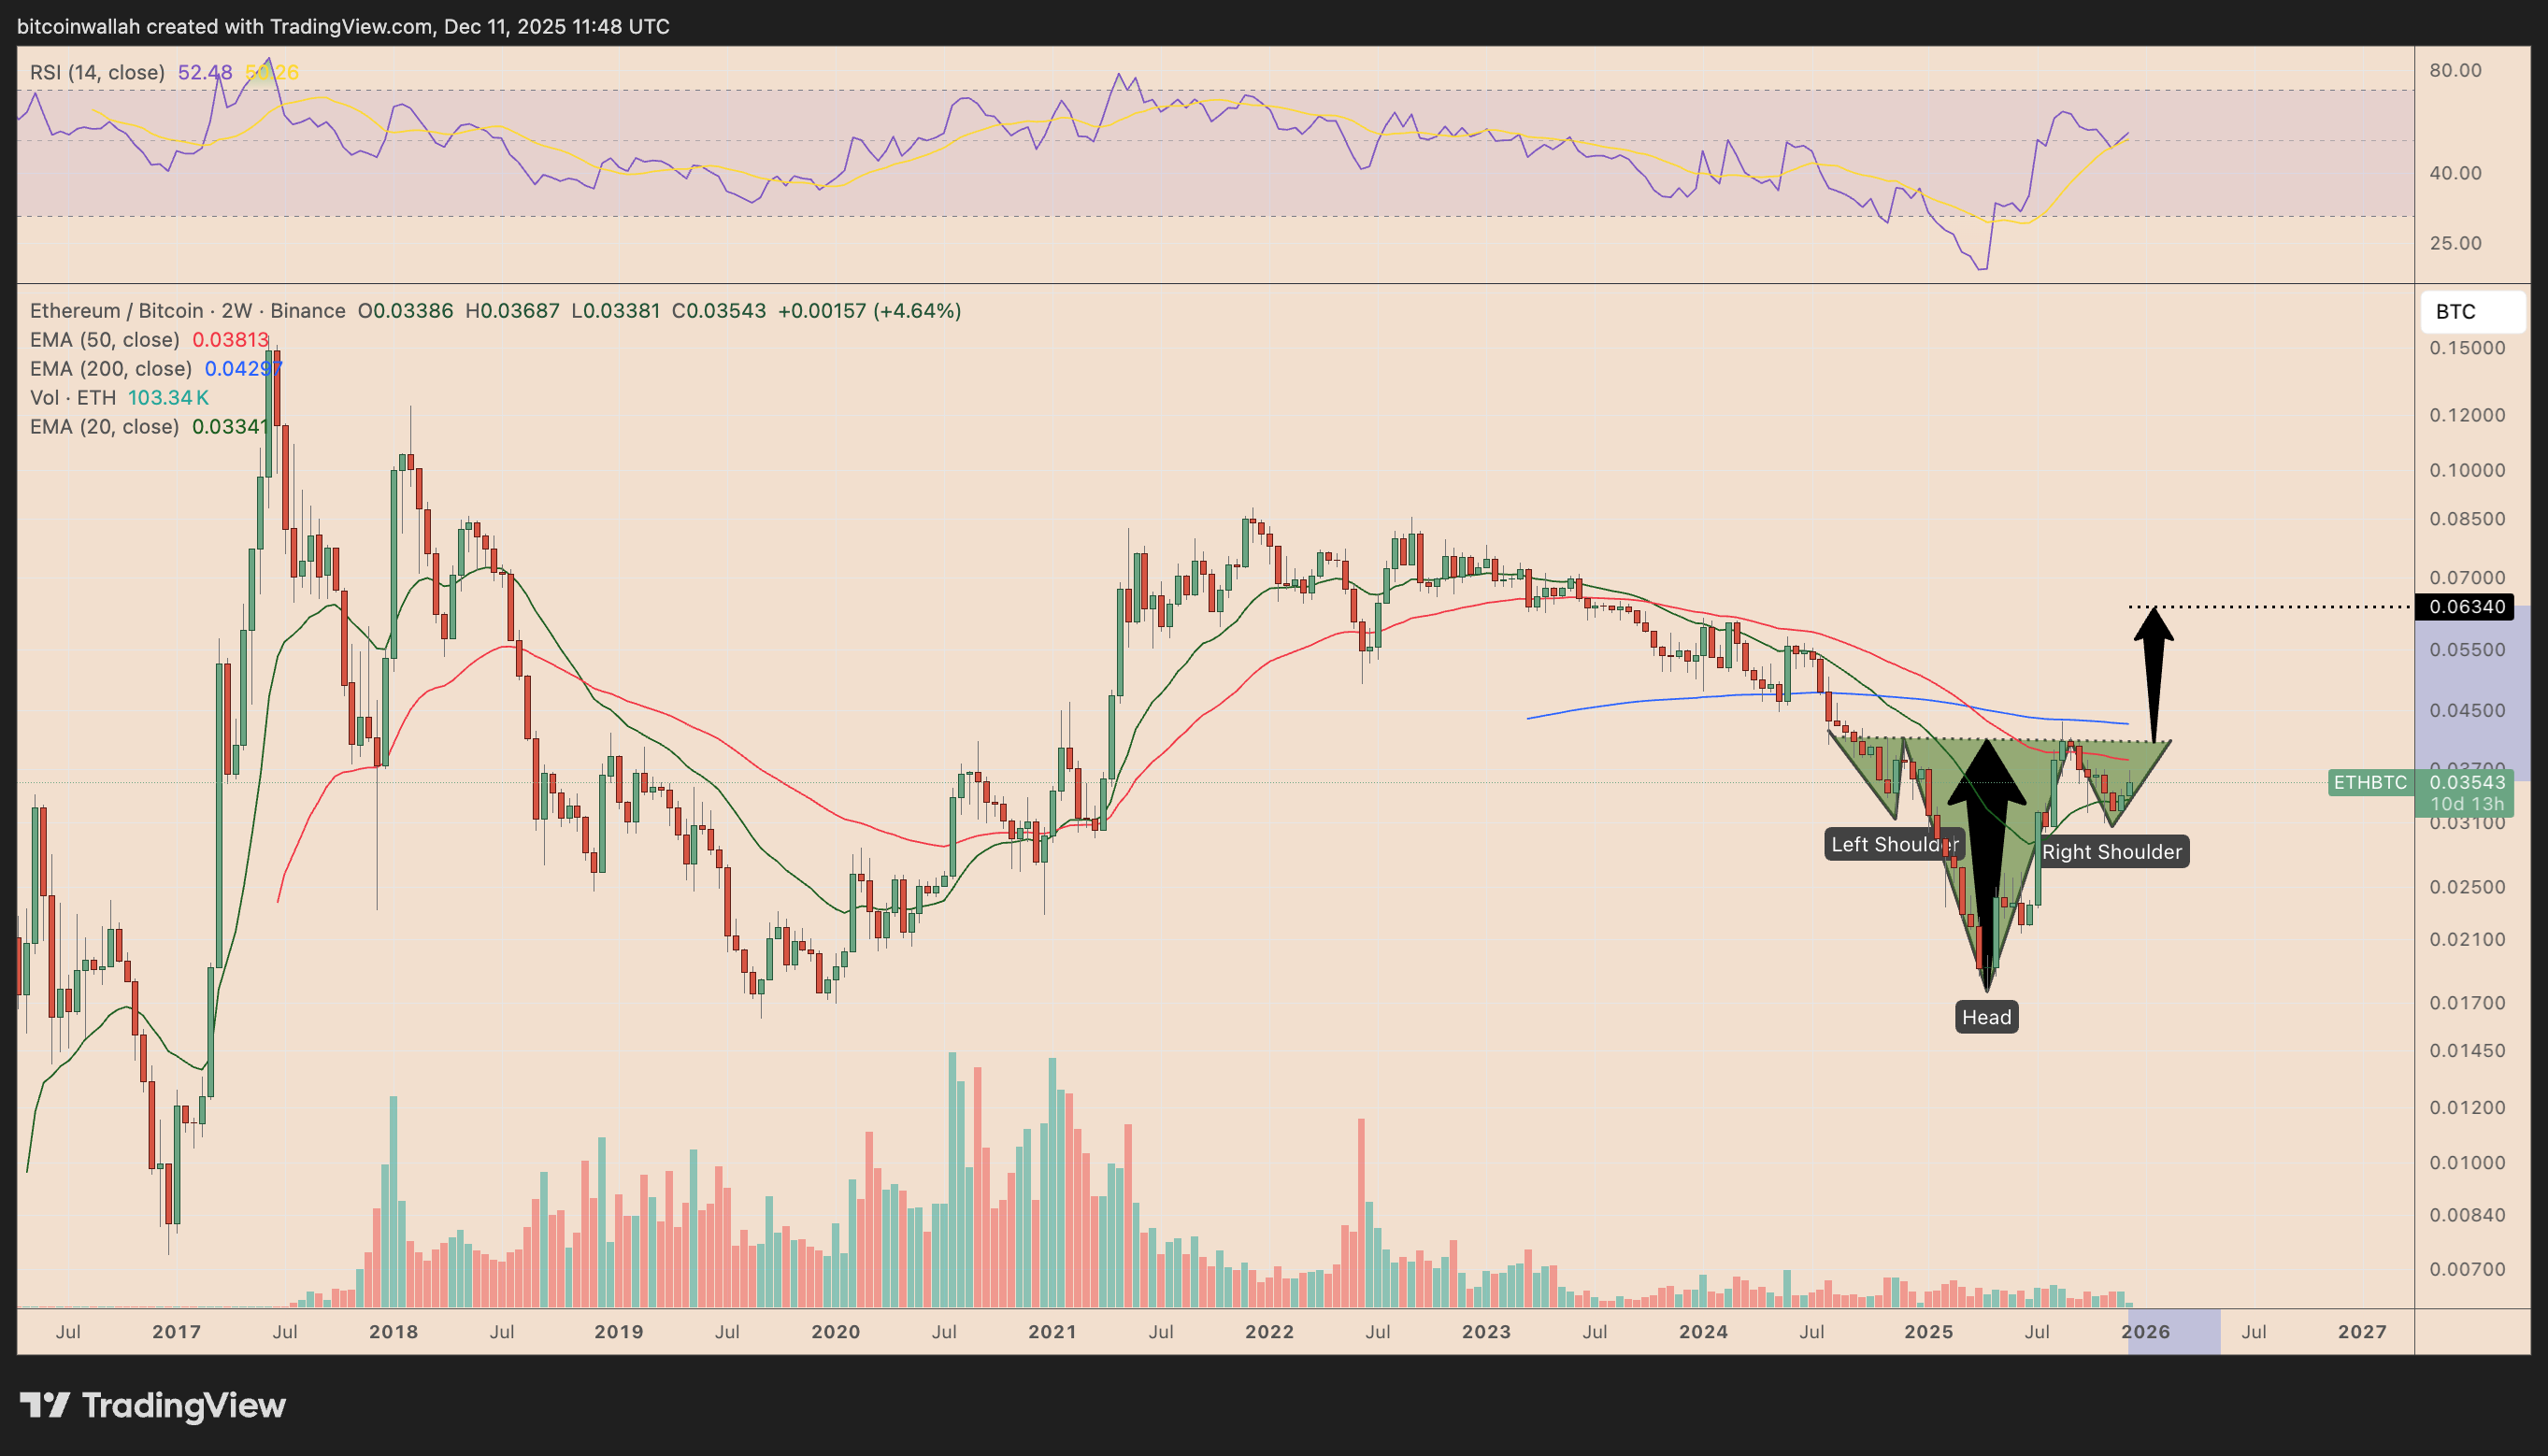
The pattern’s left shoulder formed during late-2024 weakness, followed by an aggressive capitulation in April 2025 that carved out the head around 0.0176 BTC. This subsequent recovery established a higher low in Q4 2025, forming the right shoulder.

The neckline was around 0.0400 BTC, situated between the 50-period (red) and 200-period (blue) exponential moving averages (EMAs).

Related: Ethereum rising to $3.3K proves bottom is in: Is 100% ETH rally next?

A decisive breakout above this zone will likely confirm the IH&S pattern, paving the way for a measured move toward 0.063 BTC in 2026.

This upside target was up 80% from the ETH/BTC rates recorded as of Thursday.

Can ETH copy its 450% parabolic move from 2020?

ETH/BTC’s current rebound closely mirrored the breakout that followed its 2019-2020 accumulation phase.

The pair rallied nearly 450% after bottoming within the same 0.0160–0.0200 BTC demand zone.

ETH/BTC two-week chart. Source: TradingView

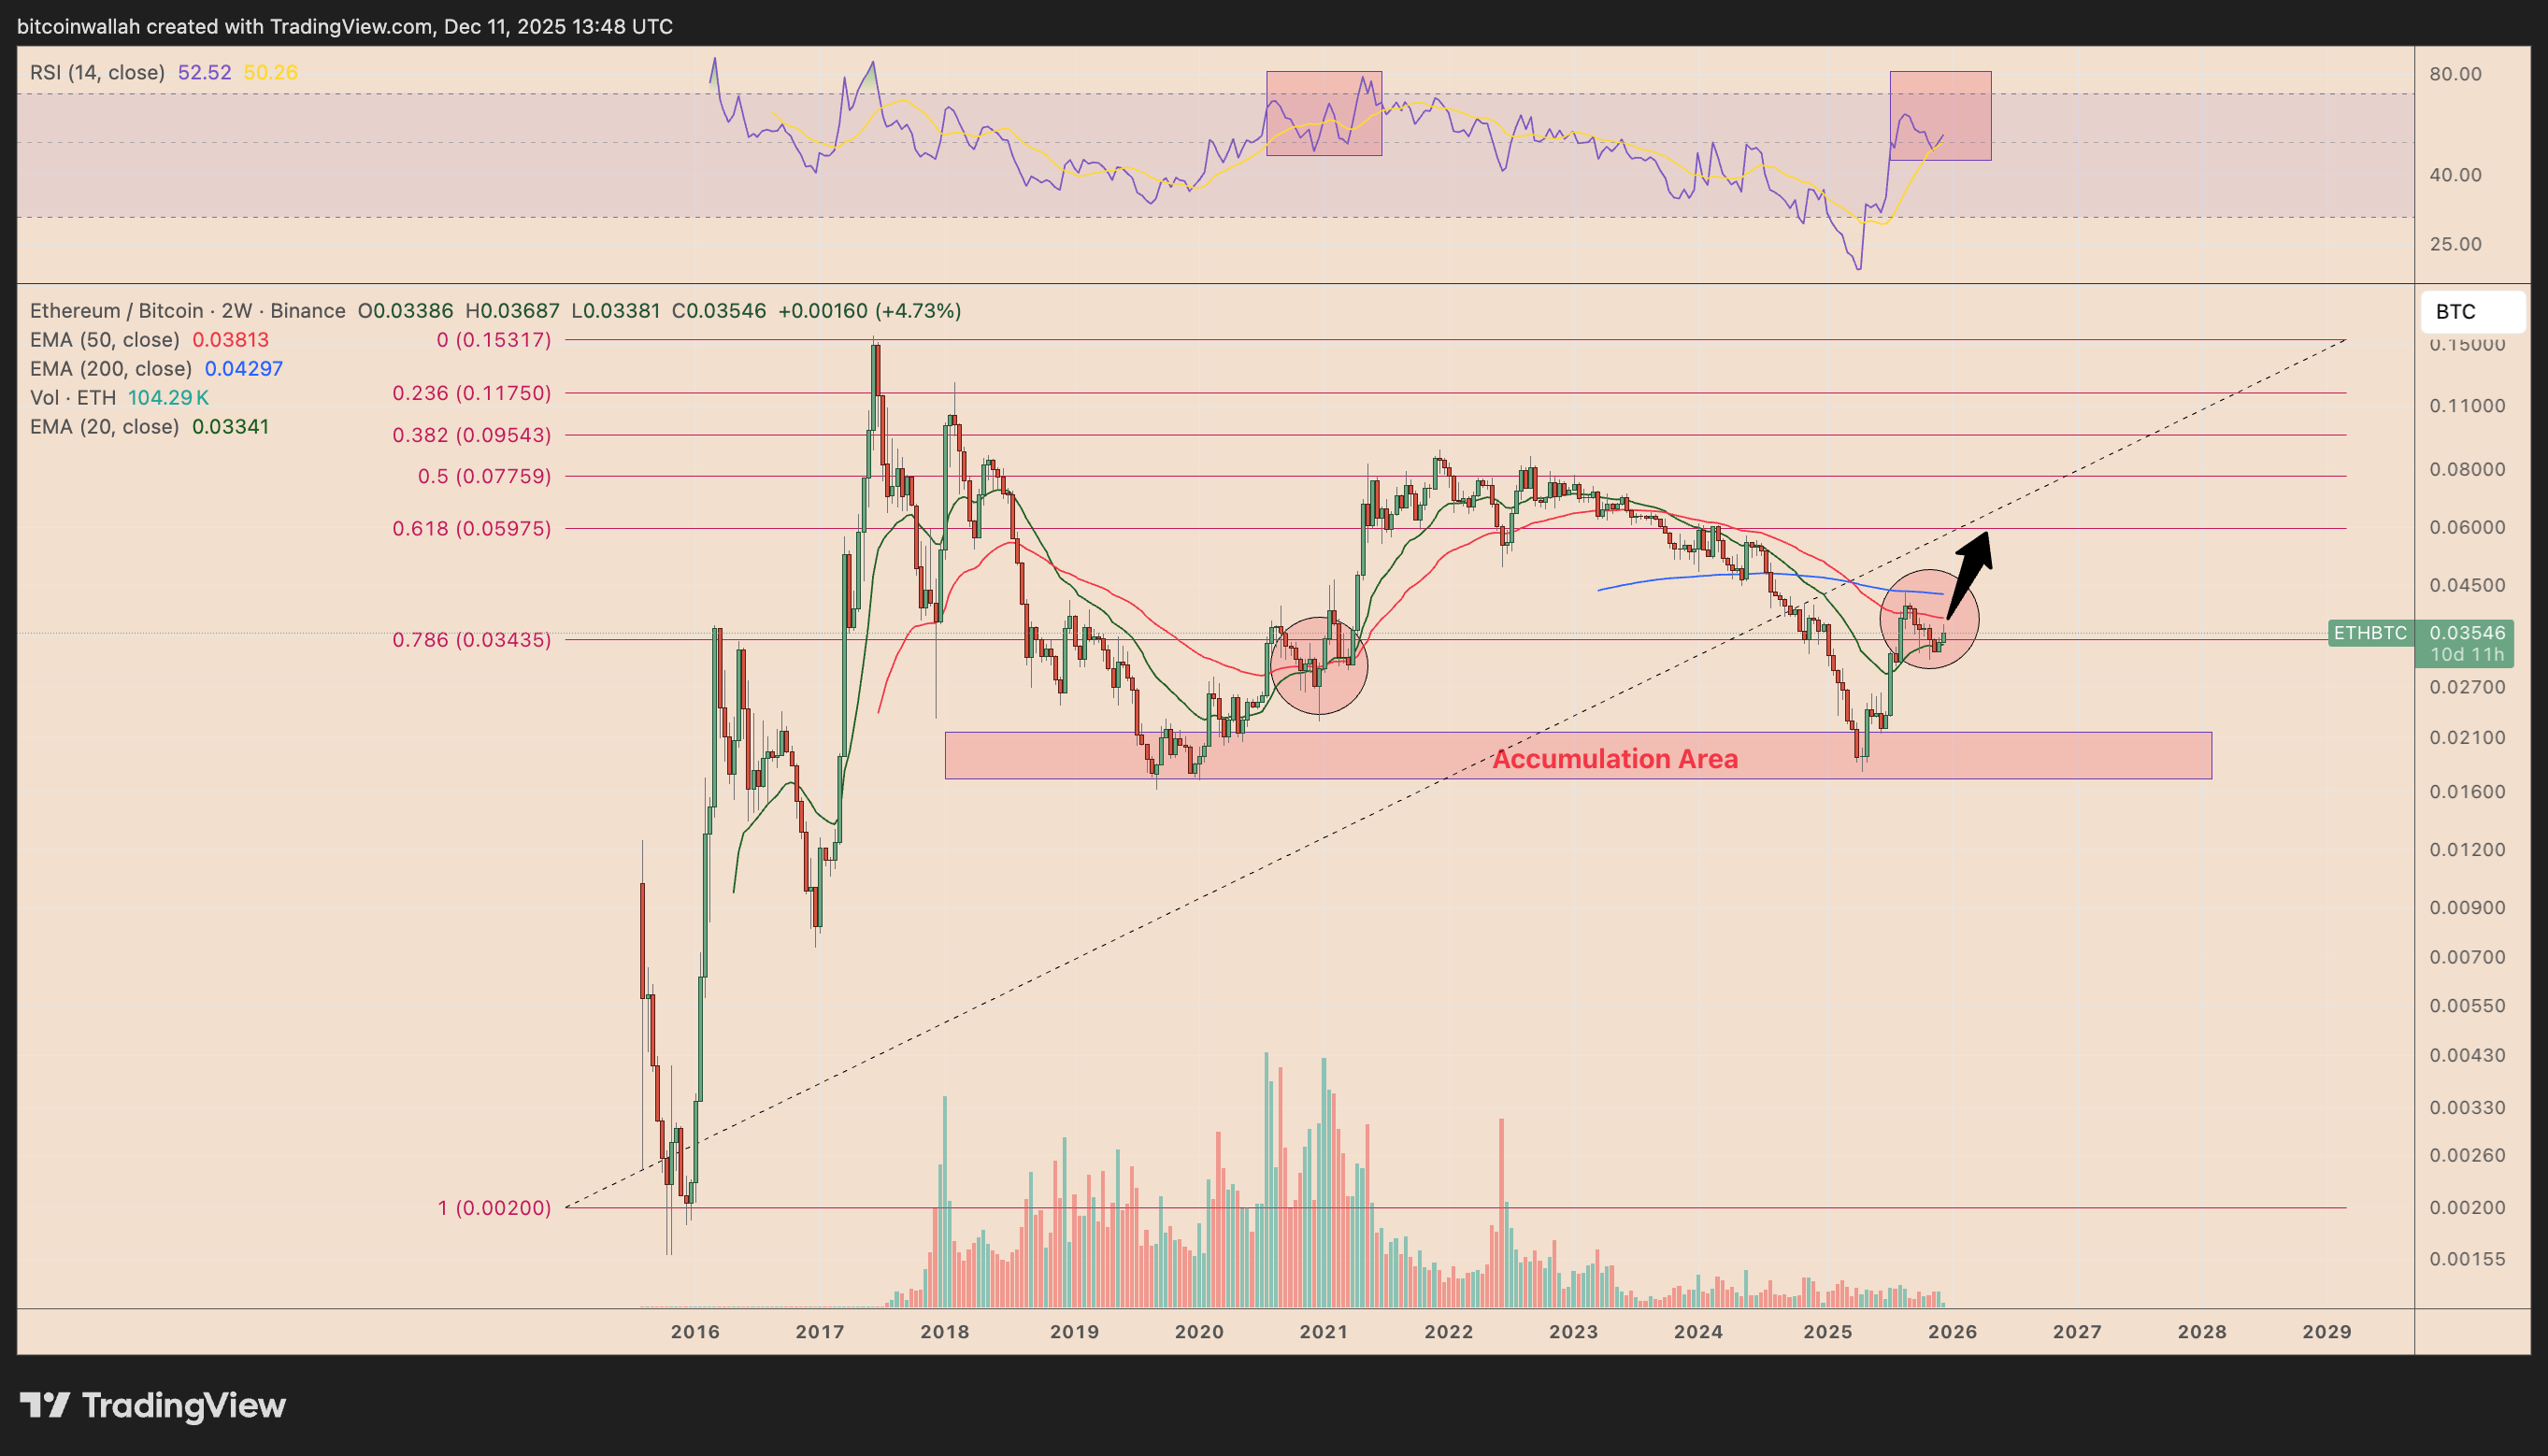
Ether’s 2025 recovery originated from this identical structural floor, and price is now pressing into the same early-stage resistance cluster (represented via red circles in the chart above) that preceded the 2020 parabolic expansion.

ETH/BTC could climb toward the 0.059 BTC Fibonacci zone, a level consistent with the IH&S breakout trajectory heading into 2026, if this fractal continues to play out.

Ethereum is still in a downtrend vs. Bitcoin

However, the ETH bulls will have to prove that the long-term downtrend is actually over.

Ether remains capped by a multiyear descending trendline that has rejected every breakout attempt against Bitcoin since 2017.

ETH/BTC two-week chart. Source: TradingView

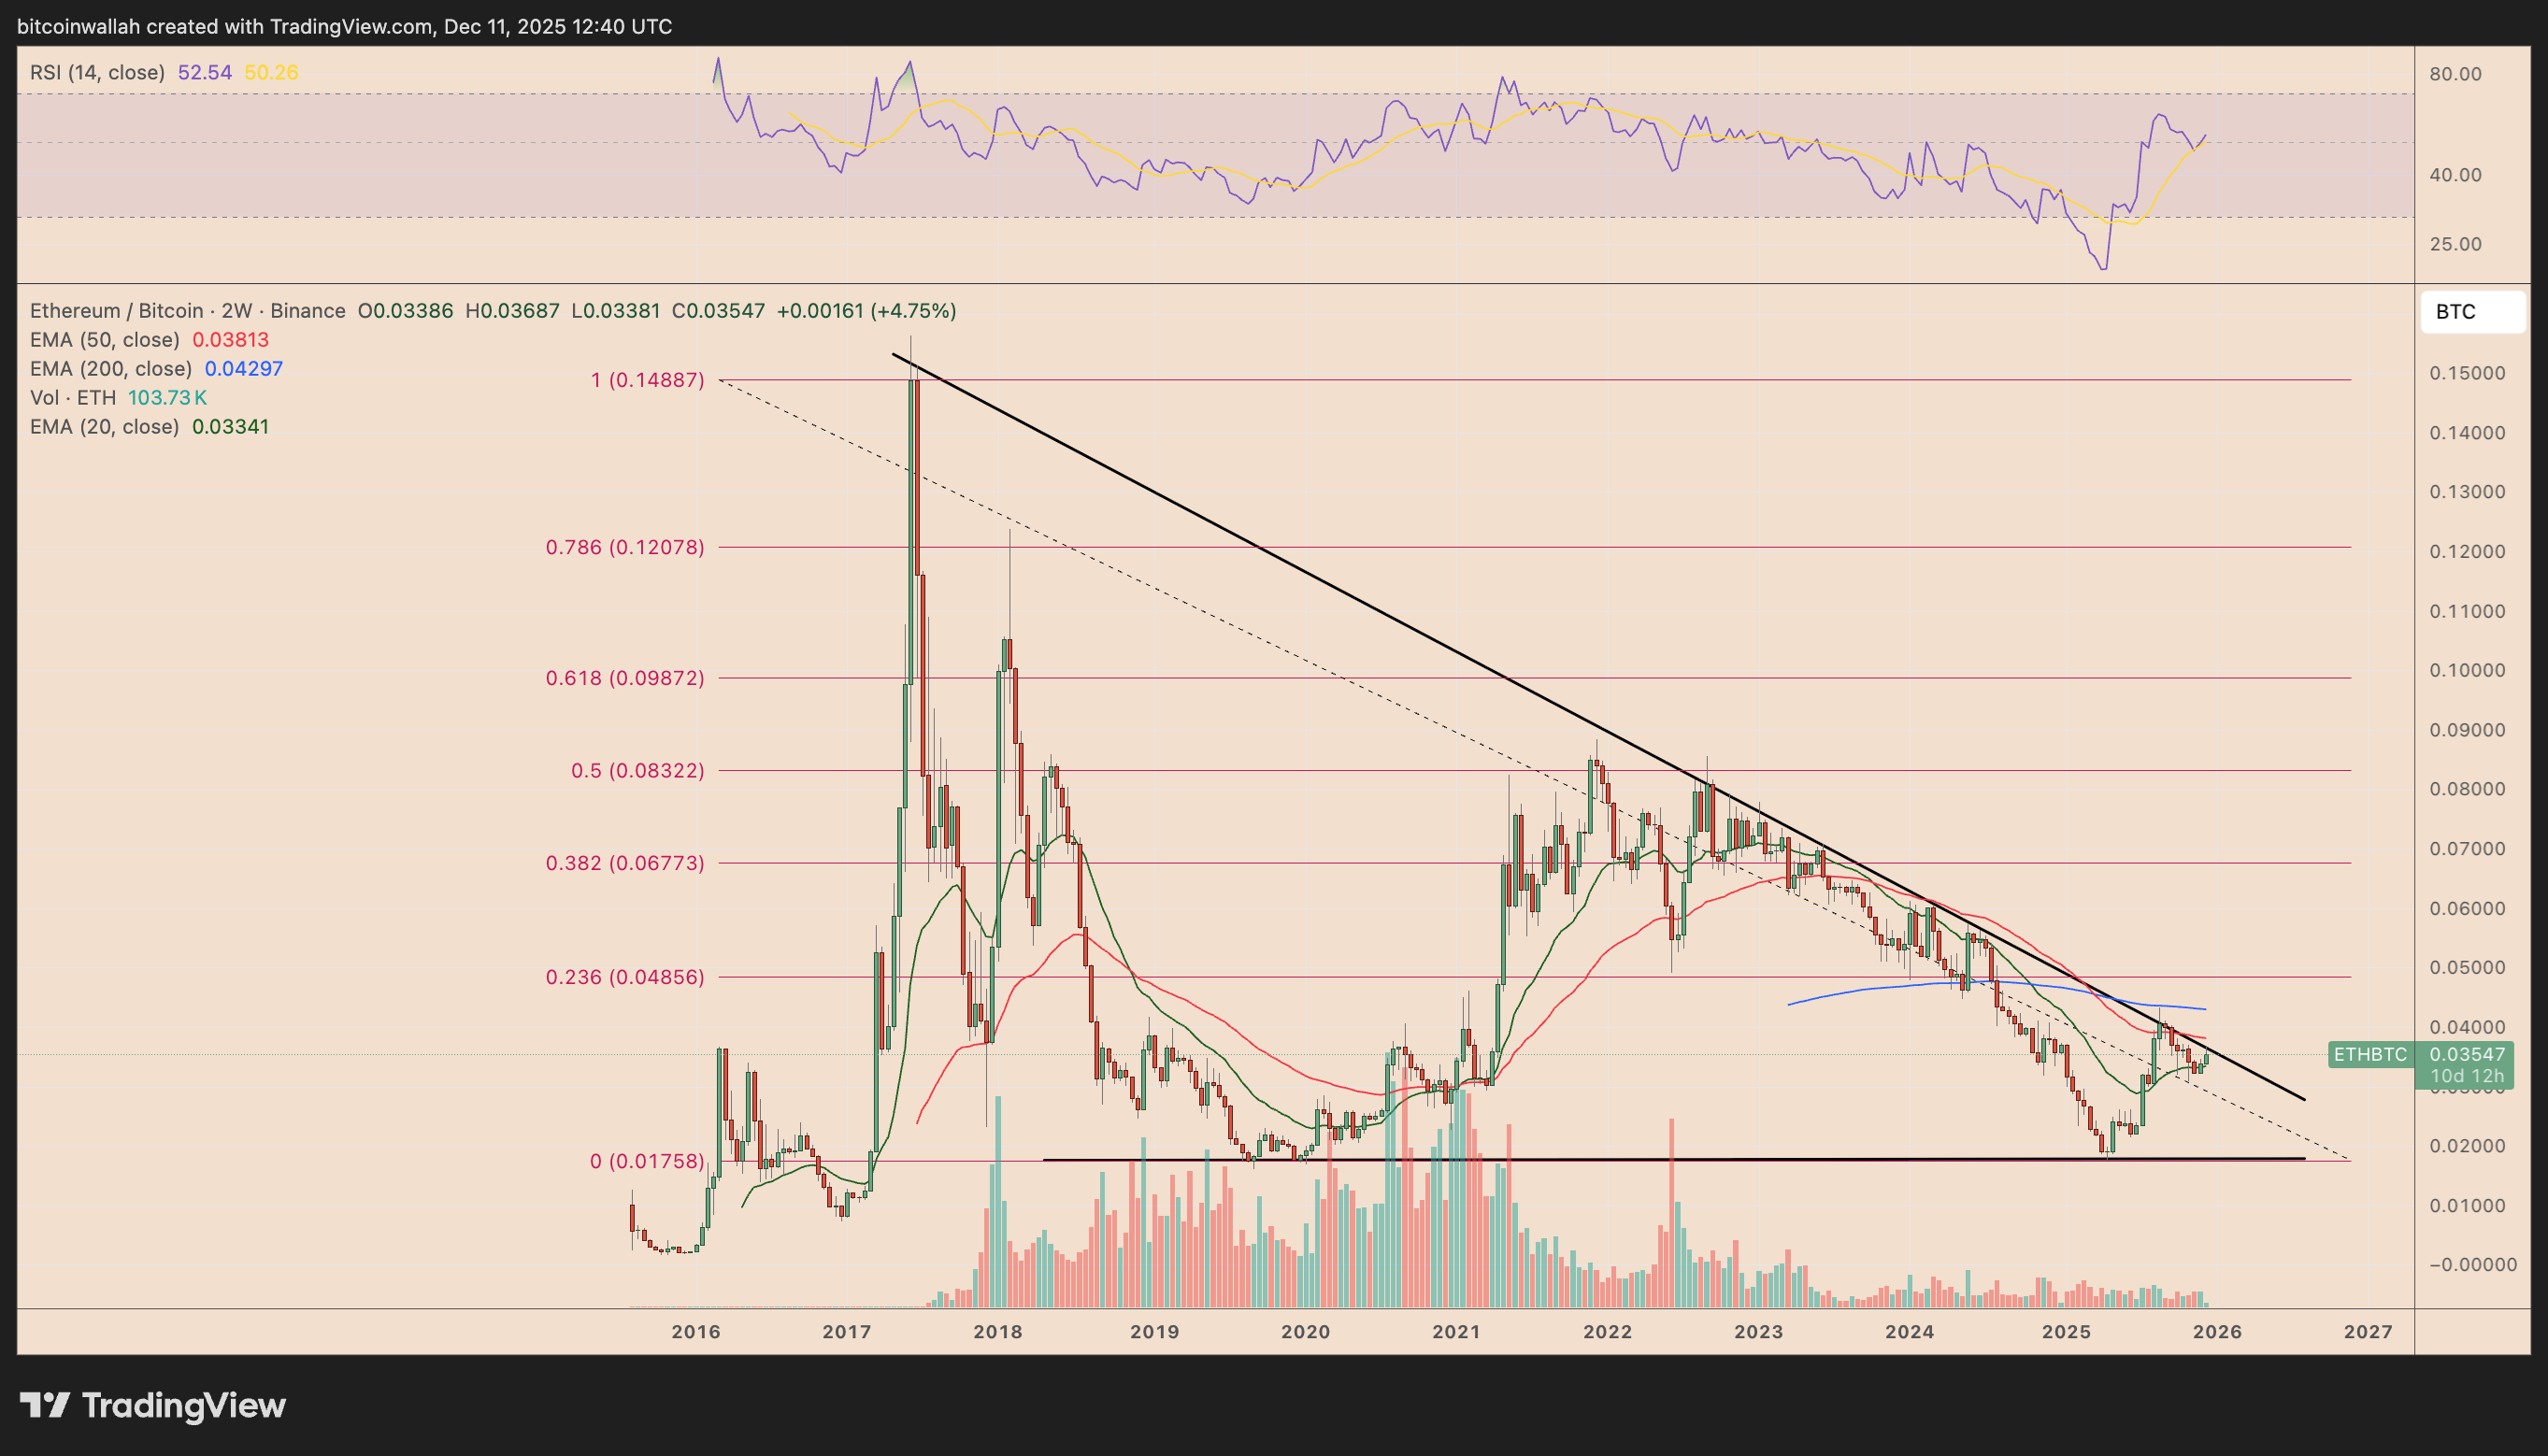
A fresh failure at this barrier would undermine the IH&S and fractal setups and raise the risk of a pullback toward the long-standing 0.0175 BTC support in 2026.

This article does not contain investment advice or recommendations. Every investment and trading move involves risk, and readers should conduct their own research when making a decision. While we strive to provide accurate and timely information, Cointelegraph does not guarantee the accuracy, completeness, or reliability of any information in this article. This article may contain forward-looking statements that are subject to risks and uncertainties. Cointelegraph will not be liable for any loss or damage arising from your reliance on this information.

Related Reads

Strategy Takes a Hardline Stance Against MSCI: What's in the 12-Page Open Letter of Defense?

In October 2024, MSCI proposed excluding companies with over 50% of their assets in digital assets from its global investable market indices, directly threatening Digital Asset Treasury (DAT) companies like MicroStrategy. Analysts warned this could trigger up to $8.8 billion in outflows, with MicroStrategy alone facing $2.8 billion in passive selling pressure. In response, MicroStrategy submitted a 12-page public letter to MSCI, strongly opposing the proposal as "misleading and destructive." The company argued that digital assets represent a revolutionary financial technology, comparable to historic infrastructure investments like oil or telecommunications. It emphasized that DATs are operational businesses with active revenue models, not passive funds, and criticized the 50% threshold as arbitrary, discriminatory, and impractical due to Bitcoin's volatility. MicroStrategy also accused MSCI of violating index neutrality and contradicting the U.S. government's pro-digital asset strategy. The company demanded MSCI withdraw the proposal or extend the consultation period. It is not alone—over 300 entities, including Strive and Bitcoin for Corporations, have joined opposition efforts, suggesting alternative indices instead of exclusion. The outcome, expected by January 2026, will significantly impact the integration of digital asset companies into traditional financial markets.

marsbit28m ago

Strategy Takes a Hardline Stance Against MSCI: What's in the 12-Page Open Letter of Defense?

marsbit28m ago

Dogecoin Price Forecast for 2026: The Path to $1 Amid Meme Rally

Dogecoin (DOGE) is back in the spotlight as retail traders return to the meme segment. Analysts express cautious optimism, suggesting that under favorable conditions, including a continued bull market and increased risk appetite, DOGE could potentially reach the $1 mark in 2026. The price is currently consolidating after volatile swings, with significant trading volumes indicating ongoing speculative interest. Key drivers remain its meme narrative, support from high-profile figures, and its correlation with Bitcoin's cycles. The path to $1 is not linear. DOGE must hold key support levels, sustain derivatives interest without overheating, and receive fresh meme-driven momentum. Technical analysis highlights the importance of watching RSI levels and volume for signs of sustainable growth versus short-term pumps. Alongside DOGE, newer, more aggressive meme tokens like Maxi Doge (MAXI) are gaining attention. Having raised approximately $4.3 million in its presale, MAXI offers high-risk, high-reward speculation with features like staking rewards and trading tournaments. While it could amplify portfolio returns during a rally, it carries significant risks associated with early-stage projects, unlike the more established DOGE. The overall strategy for many investors is to combine a core position in DOGE with a smaller, speculative bet on tokens like MAXI to capitalize on the potential meme rally.

bitcoinist39m ago

Dogecoin Price Forecast for 2026: The Path to $1 Amid Meme Rally

bitcoinist39m ago

Trading

Spot
Futures
活动图片